Example
There are some steps on how to use energy_manager in any project:
1. Installation
#%pip install energy_manager
2. Imports
import os
import seaborn as sns
import matplotlib.pyplot as plt
from energy_manager.classes.energy_manager import EnergyManager
3. Explore the class EnergyManager
help(EnergyManager)
Help on class EnergyManager in module energy_manager.classes.energy_manager:

class EnergyManager(builtins.object)
 |  EnergyManager(city_name: str, dpe_usage: float, temperature: float, openweathermap_api_key: str, insulation_factor: float = 1.0)
 |
 |  Manages energy consumption and calculates expenses based on provided parameters.
 |
 |  This class is designed to handle energy management by leveraging data like
 |  city name, average energy usage, temperature, and insulation factor. It interacts
 |  with external APIs to compute daily energy expenses, taking into consideration
 |  climatic and usage factors.
 |
 |  Attributes:
 |      _city_name (str): The name of the city for which energy expenses are calculated.
 |      _dpe_usage (float): The average energy usage (DPE - Diagnostic de Performance
 |          Énergétique) of the property in kWh/m².year.
 |      _temperature (float): The current temperature in the city, used for expense calculations.
 |      _openweathermap_api_key (str): API key for accessing OpenWeatherMap's forecast data.
 |      _insulation_factor (float): Adjustment factor accounting for the property's insulation
 |          efficiency. Defaults to 1.0, corresponding to standard insulation.
 |
 |  Methods defined here:
 |
 |  __init__(self, city_name: str, dpe_usage: float, temperature: float, openweathermap_api_key: str, insulation_factor: float = 1.0)
 |      Initialize self.  See help(type(self)) for accurate signature.
 |
 |  get_daily_expenses(self) -> pandas.core.frame.DataFrame
 |
 |  ----------------------------------------------------------------------
 |  Data descriptors defined here:
 |
 |  __dict__
 |      dictionary for instance variables
 |
 |  __weakref__
 |      list of weak references to the object
2. Define mandatory parameters
user_city_name = "Nangis"
openweathermap_api_key = os.getenv("OPEN_WEATHER_API_KEY") # if you set your openweathermap api key as an environment variable
user_temperature = 19.5
user_dpe_usage = 1.5
3. Define optional parameters if you want
user_insulation_factor = 1.5 # 1.0 is the default value set in the EnergyManager class
4. Instantiate the class EnergyManager with your set of parameters
my_energy_manager = EnergyManager(
    city_name=user_city_name,
    openweathermap_api_key=openweathermap_api_key,
    temperature=user_temperature,
    dpe_usage=user_dpe_usage,
    insulation_factor=user_insulation_factor,
)

daily_expenses_df = my_energy_manager.get_daily_expenses()
5. Explore results of daily_expenses_df and do any manipulation you want
daily_expenses_df.dtypes
date_time              datetime64[ns]
weather_description            object
option_0                      float64
option_1                      float64
option_2                      float64
option_3                      float64
option_4                      float64
building_type                  object
dpe_class                      object
dtype: object
daily_expenses_df[["date_time", "weather_description", "building_type", "dpe_class", "option_0", "option_3"]].head()
| date_time | weather_description | building_type | dpe_class | option_0 | option_3 | |
|---|---|---|---|---|---|---|
| 0 | 2024-12-27 00:00:00 | clear sky | Appartement | A | 3.755618 | 3.086891 |
| 1 | 2024-12-27 01:00:00 | clear sky | Appartement | A | 3.866196 | 3.177779 |
| 2 | 2024-12-27 02:00:00 | few clouds | Appartement | A | 3.689272 | 3.032358 |
| 3 | 2024-12-27 03:00:00 | few clouds | Appartement | A | 3.723450 | 3.060451 |
| 4 | 2024-12-27 04:00:00 | scattered clouds | Appartement | A | 3.761650 | 3.091849 |
6. Results meaning
Columns option_0, option_1, …, option_4 values are energy costs in euros per square meter.
Settings of these 5 options provided by ENEDIS for EDF consumers are such as :
option_0 : energy price is the same at any hour of the day with a value of 25.16 euros/kwh;
option_1, …, option_4 : energy price during peak hour is 27 euros/Kwh and is 20.68 euros/Kwh during for off-peak hours.
The first row of df_daily_expenses means that for the day 2024-12-26 from 00:00:00 to 01:00:00, if your house is an “Appartement” and has a DPE (diagnostic de performance energetique) of class A, your estimated energy cost for the option_0 is approximately less than 3 euros per square meter for the desired temperature of 19.5 degrees Celsius.
mask = (daily_expenses_df["building_type"] == "Appartement") & (daily_expenses_df["dpe_class"] == "A")
new_df = daily_expenses_df[mask]
new_df[["date_time", "weather_description", "dpe_class", "option_0", "option_3"]].head(n=10)
| date_time | weather_description | dpe_class | option_0 | option_3 | |
|---|---|---|---|---|---|
| 0 | 2024-12-27 00:00:00 | clear sky | A | 3.755618 | 3.086891 |
| 1 | 2024-12-27 01:00:00 | clear sky | A | 3.866196 | 3.177779 |
| 2 | 2024-12-27 02:00:00 | few clouds | A | 3.689272 | 3.032358 |
| 3 | 2024-12-27 03:00:00 | few clouds | A | 3.723450 | 3.060451 |
| 4 | 2024-12-27 04:00:00 | scattered clouds | A | 3.761650 | 3.091849 |
| 5 | 2024-12-27 05:00:00 | scattered clouds | A | 4.091372 | 3.362861 |
| 6 | 2024-12-27 06:00:00 | clear sky | A | 3.789797 | 3.114984 |
| 7 | 2024-12-27 07:00:00 | few clouds | A | 3.781755 | 3.108374 |
| 8 | 2024-12-27 08:00:00 | few clouds | A | 3.755618 | 4.030274 |
| 9 | 2024-12-27 09:00:00 | few clouds | A | 3.492242 | 3.747637 |
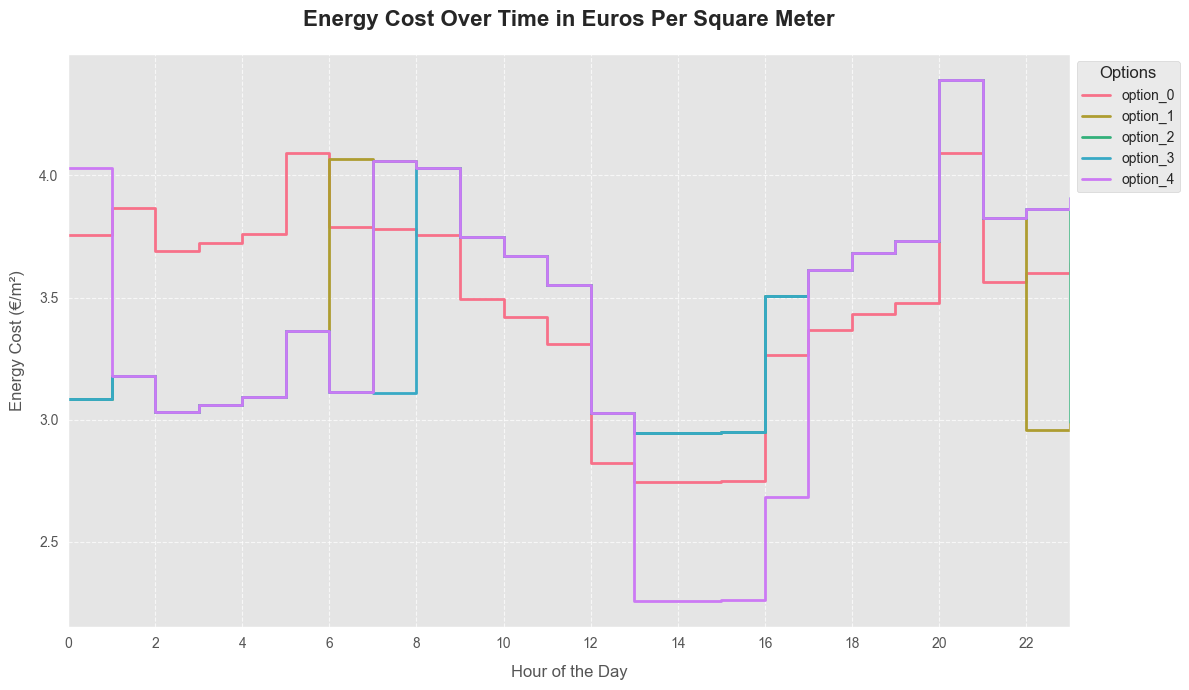
plt.style.use('ggplot')
fig, ax = plt.subplots(figsize=(12, 7), dpi=100)
colors = sns.color_palette("husl", 5)

for i, option in enumerate(["option_0", "option_1", "option_2", "option_3", "option_4"]):
    ax.step(new_df.date_time.dt.hour, new_df[option], where="post", label=option,
            linewidth=2, color=colors[i])

ax.set_title("Energy Cost Over Time in Euros Per Square Meter", fontsize=16, fontweight='bold', pad=20)
ax.set_xlabel("Hour of the Day", fontsize=12, labelpad=10)
ax.set_ylabel("Energy Cost (€/m²)", fontsize=12, labelpad=10)
ax.set_xticks(range(0, 24, 2))
ax.set_xlim(0, 23)
ax.tick_params(axis='both', which='major', labelsize=10)
ax.legend(title="Options", title_fontsize='12', fontsize='10', loc='upper left', bbox_to_anchor=(1, 1))
ax.grid(True, linestyle='--', alpha=0.7)

plt.tight_layout()
plt.show()